Business Processing Monitoring
.svg)
Solution Overview
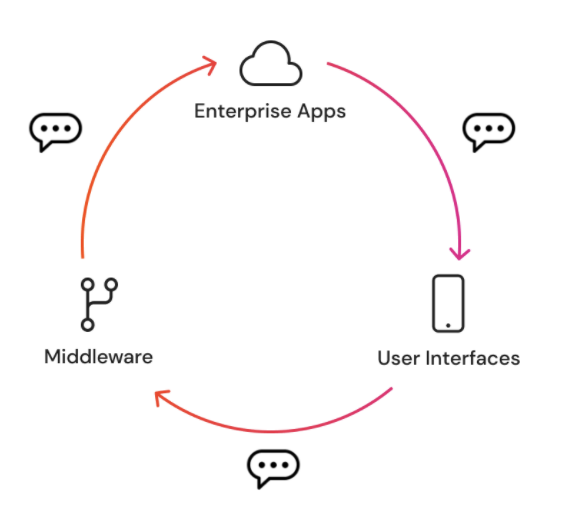
Modern business processes often span multiple enterprise applications that are deployed either on-premises or in the cloud, with each application focusing on a specific domain such as order management, shipping, or payments. Middleware components are used to coordinate between the applications to synchronize the overall business process. Customers access the process through various channels like mobile apps and Facebook Messenger.
However, real-time monitoring of these distributed asynchronous processes can be challenging. Late visibility into the process status can lead to poor customer experiences and unnecessary interference from call center agents. A GraphQL-based solution using Dgraph can help provide timely visibility into the distributed business process.
This example demonstrates how to monitor distributed business processes across multiple enterprise applications using Dgraph capabilities such as the GraphQL API and Lambdas. You will learn how to leverage these components to store, inspect, and create incidents for effective process monitoring.
Note: Dgraph Cloud provides an easy way to create the schema and run queries and mutations. You can follow Quickstart steps to get started.
Process Monitoring in the Modern World
Process Monitoring Challenges
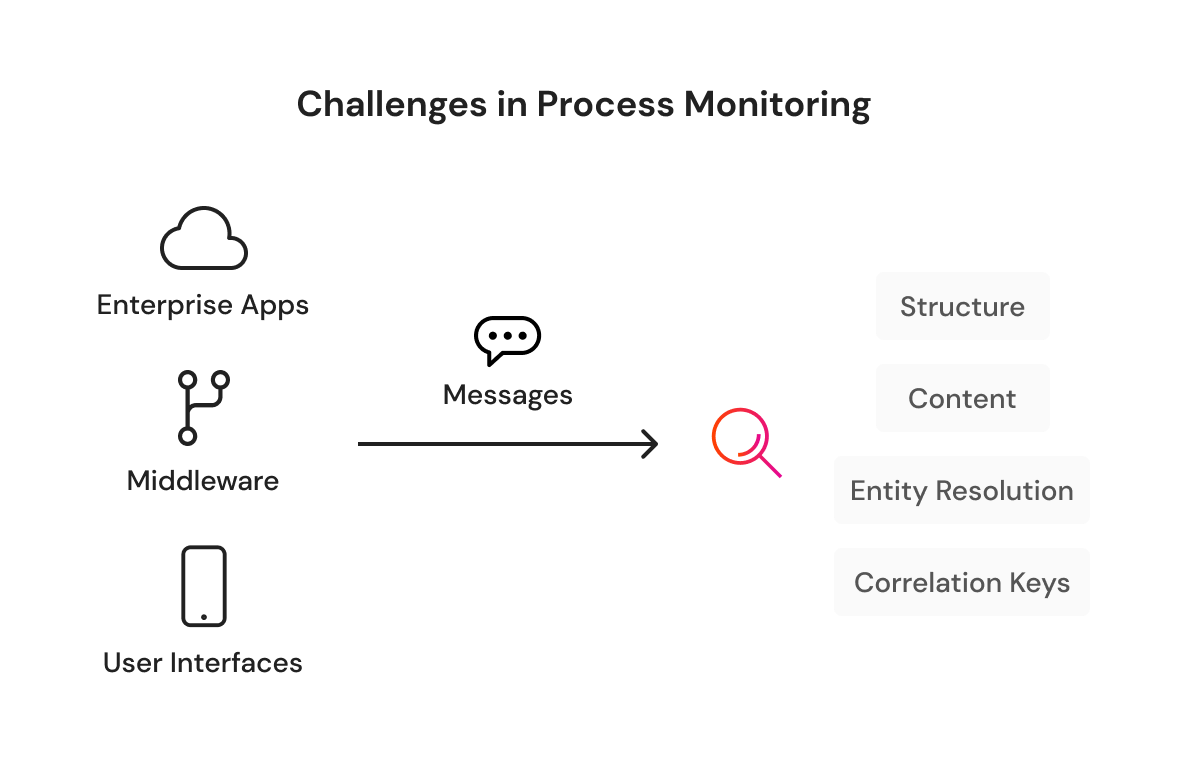
A simple approach to creating a process monitoring solution would be to route all your important logs, events, and message payloads from respective applications into a common storage layer and then use this layer to drive queries.
However, there are several challenges involved in this process.
* Data from different apps is in inconsistent formats (fixed-width text, XML, JSON, etc.)
* Data fields are not standardized (customer name could be in different fields)
* Values are not standardized (currency code could be 3-digit code or text)
* IDs are not consistent across apps (order number would differ between apps)
These inconsistencies make it difficult to aggregate data and get a holistic view of a distributed business process. A GraphQL-based solution would need to account for the varied data formats, fields, values, and IDs in order to combine information from multiple enterprise applications.
In order to build an effective monitoring solution that addresses the challenges mentioned above, you will need to involve team members from these distributed apps and find a way to incorporate their knowledge about structure, content, interpretations, etc. in your solution.
You could consider the methodology explained in this blog to use a GraphQL API running on Dgraph Cloud GraphQL for a coordinated solution to this problem.
Process Monitoring using Dgraph
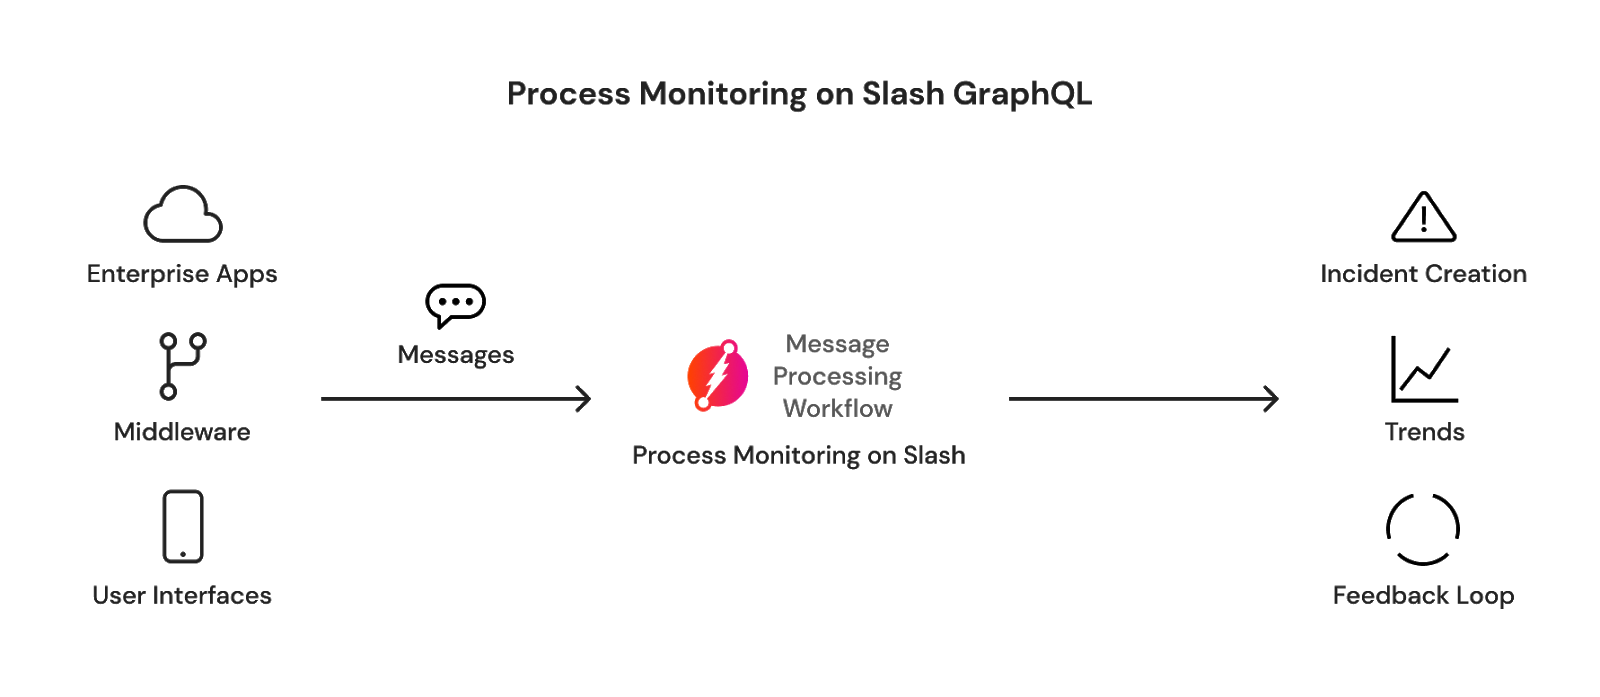
You can use Dgraph Cloud and GraphQL to build a robust process monitoring system. The solution will have two main parts:
- A GraphQL API for ingesting messages. The API will accept messages from different apps in various formats. GraphQL will allow you to define interfaces tailored to each app's data. For unstructured data like logs, the interface will be simple strings. For structured data like incidents, the interface will match the data format.
- A message processing workflow. The workflow will analyze message content using Dgraph Cloud. It will consist of small, discrete steps implemented as Lambdas on Dgraph Cloud. The Lambdas will extract structured data, handle errors, enrich data by accessing external sources, transform data, and store the results.
Overall, the GraphQL API will provide a standard way to input data, then the message processing workflow will handle the data consistently and store the results. This will enable monitoring of the distributed business process.
The Dgraph Cloud-based message processing workflow will produce a graph that will provide near real-time and correlated visibility over your entire enterprise. You can use this graph to drive incident creation (ticketing) as well as extract trends for analytics.
A less understood aspect is that many modern apps and middleware have sophisticated operating capabilities. For example, modern cloud components such as queuing engines are capable of automatically managing issues if the right levers of throttling https://camel.apache.org/components/3.4.x/eips/throttle-eip.html or scaling are engaged.
This implies that modern business process monitoring solutions need to treat these levers as first-class digital citizens. You can choose to connect levers such as throttling, scaling, etc. available in the enterprise directly to this graph. This creates a feedback loop where-in the graph can be used to measure and tune the effects of engaging these control levers. For example, you can answer questions like, “Did the throttling applied on the middleware help in reducing the end-to-end processing time on the backend DB?”.
Finally, you can use the Dgraph Cloud GraphQL API to drive these visibility and feedback-related processes. You do not need to take any overhead for provisioning an API for your monitoring teams as Dgraph Cloud will be providing a GraphQL API for you out of the box.
The Role of Dgraph Cloud Lambdas and JavaScript
Dgraph Cloud Lambdas lets you write functions in JavaScript to perform tasks in the message processing workflow. They make it easy to:
* Access GraphQL and [DQL](https://dgraph.io/docs/get-started/) (Dgraph query language)
* Make external HTTP calls
JavaScript is an easy-to-use language, and the Lambdas allow separate teams to work on different functions. This frees you up to focus on other parts of the overall process monitoring solution. The Lambdas act as modular components that can be developed and updated independently, enabling a flexible, collaborative process.
GraphQL Schema For Process Monitoring
In the simplified example in this use case, you are storing, evaluating, and correlating events and messages related to an Order to Cash process. You can model the messages and events in the enterprise as a type `Event`. You can start with a relaxed model with just the source application and the payload of the event. As events arrive, you will use `ExtractProcess`, a Lambda to correlate the messages and connect to a type `Process`. You will store the correlation key, in this case the order id, in the process type. Finally, any error detected via the Lambda `MessageCheck` will result in the creation of an incident. A specific type, `Incident`, is used to store these incidents.
The Lambda functions need to be called in a certain sequence (`ExtractProcess`, then `MessageCheck`, and perhaps any other cleanup steps). You will be stepping through these steps manually in this example. You can use any simple orchestration engine such as Apache Camel to automate this.
The `ExtractProcess` receives an event id argument and looks it up via a GraphQL query. You will implement any custom parsing and correlation required in this Lambda. In this example, the messages are simple text with comma separation. The first field is an order id, while the second field is a text message. You will extract the order id and then check if a process already exists that is related to this order id. If found, you will link this event to the process object, otherwise, you will create a new process and link the event.
The `MessageCheck` Lambda also receives an event id. You can write all checks required for process monitoring in this Lambda. Javascript has good support for various string operations and is a good choice to implement such checks. For advanced use cases, you can leverage the underlying Dgraph DQL functions, including those related to fuzzy text searches, geospatial functions, aggregates, shortest path functions, and others. In this example, you will write a simple check that checks that a customer's mobile number is absent. If the mobile number is indeed absent, you will create an `Incident` using the GraphQL API. This is the end of the message processing workflow in this example.
You can deploy the above schema and Lambda in your Dgraph Cloud instance. You can then begin testing out this simple monitoring solution.
Step-by-Step walkthrough
First, you will generate an event. Let's assume that you received a message from your sales application. This event or message will contain the application name (`Sales`) and a payload. In the payload, you will pass a comma-separated string with the order id and the text message from the sales application.
You can connect this event to a process instance by calling the `ExtractProcess` Lambda. As explained previously, this Lambda is responsible for correlating the incoming event to a process and it uses an order id as the correlation key. This process will become the reference point to all future events related to this particular order id. Let's assume that the id of the event is `0x3e`.
In the screenshot above, you can observe that the order is extracted and attached to a process object. The correlation key, order id, is now stored in the type `Process`. Let's conclude the message processing workflow for this sales event at this junction.
Now let's assume that the order is being processed, and is now being delivered through a logistics partner. At this point, you might receive a message that the mobile number of the receiving partner is not available in the order. This is worthy of raising an incident. You will now generate this logistics partner-related event. Let's assume that this event is created with an id `0x40`.
As previously done, you will call the `ExtractProcess` Lambda to connect to a `Process`. In this case, since a process object already exists, the newly created logistics partner event will connect with this existing process object.
We will now do a message check. This message check will observe that the payload of the event contains the text "Mobile number of customer is Absent ", and will raise an incident on this.
You can query for created incidents, and you will find an incident created in Dgraph as above. This can be queried by middleware or other tools and an actual ticket can be created.
Conclusion
In this use case overview, you walked through a simplified example of process monitoring. You leveraged the GraphQL API to describe events, messages, processes as well as incidents. You also used Lambdas to enforce message checks using simple JavaScript functions. Finally, you created incident objects that can in turn be used to create actual incidents in your enterprise.
You can review some additional blogs for related information.
- Entity Resolution Use Case will help you deal with advanced correlation needs.
- Building a Customer Journey Using Domain Driven Design and GraphQL will help you build customized experiences for agents working on incidents using Domain Driven Design (DDD) techniques.


.svg)
